
−20% transport kilometres
Smarter transport starts with conscious choices in the supply chain. With more efficient routes, we drive fewer kilometres for the same delivery.
Now
we measureTarget
−20% km
we measureTarget
−20% km







Sustainability

Sustainability: put into practice every day.
Baking tomorrow
For the ingredients, for the dough and for the baking process. But also for the energy we use, the water we need and what’s left over after production.
We’ll take you through our process, from raw materials to the next improvement. We’ll show you which results we measure and where we want to improve further.
Not everything has been resolved. Not every step has been taken yet. That is why we continue to look ahead, invest and make adjustments.
01 · The big picture
Behind every loaf of bread lie choices about raw materials, production, technology and transport. In 2025, our turnover grew by 4%. In the same year, our electricity consumption and the amount of tap water we drew both fell. We are growing, but our impact does not have to grow with us.
02 · Energy
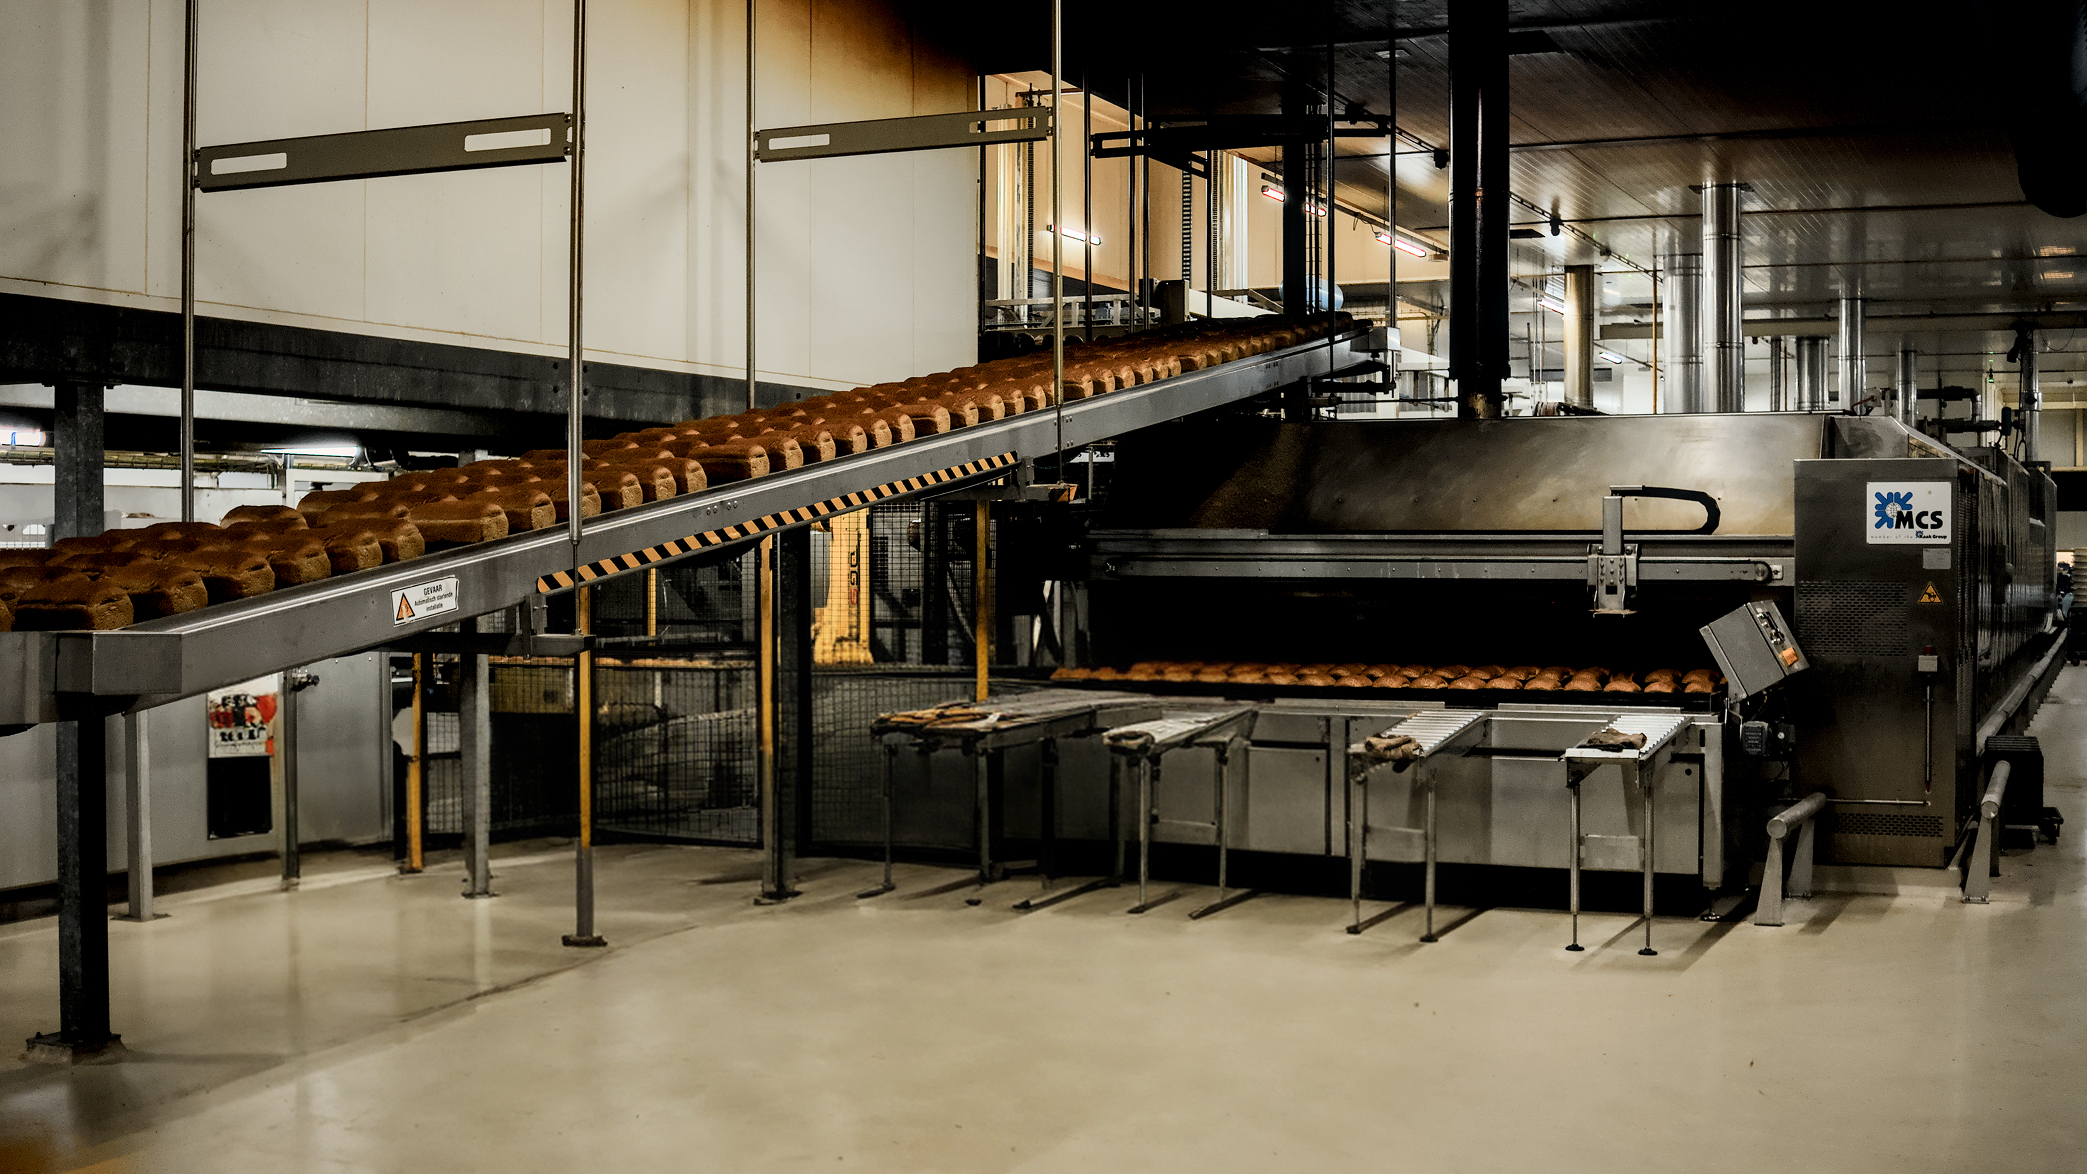
Our bakery runs around the clock. Ovens, refrigeration and production lines use a great deal of energy. That is why we track where we use electricity and which improvements really make a difference. For electricity, the step is a big one. Gas and diesel are falling too, but more slowly.
Electricity · total consumption
“We use every kilowatt-hour in our process. That’s why we don’t just look at the final figure, but also at what lies behind it.”
What still needs to improve
03 · Water
Water is needed in the product and for keeping the bakery clean. It is about using water carefully, within the requirements for quality and hygiene.
Water · two measures
tap water drawn
22,758 → 16,625 m³
water consumption, withdrawal minus discharge
8,063 → 7,026 m³
“Water is part of our craft. That is exactly why it deserves attention. We look at where it is needed and where we can save.”
What we’re working towards
04 · Residual streams
What isn’t wasted doesn’t have to be thrown away. Ideally, we prevent anything from being left over. Whatever does remain, we give a new purpose wherever possible.
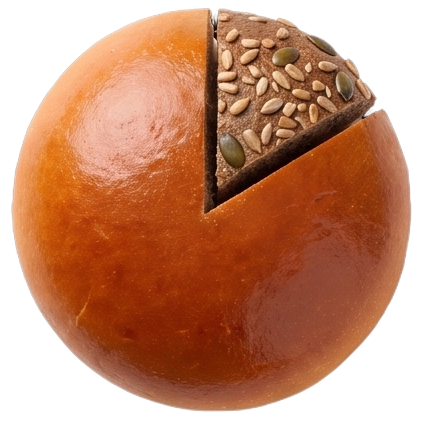
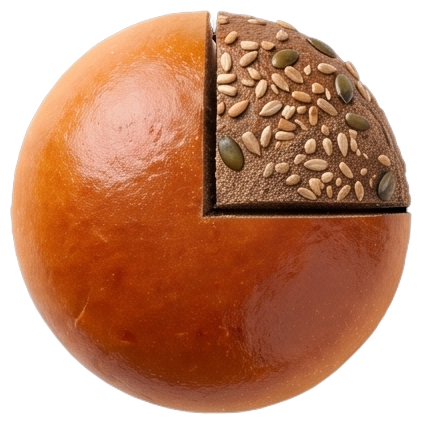
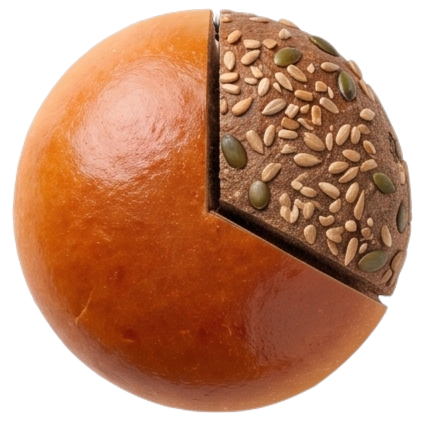
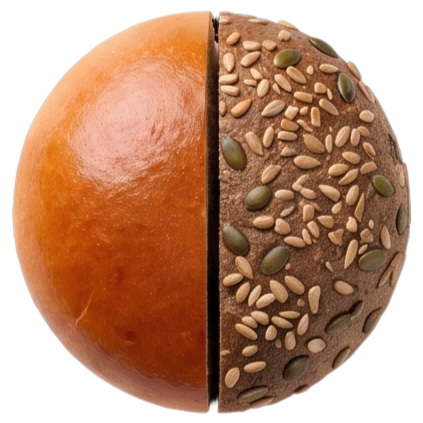
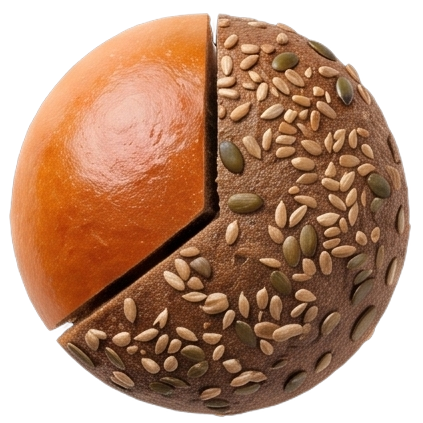
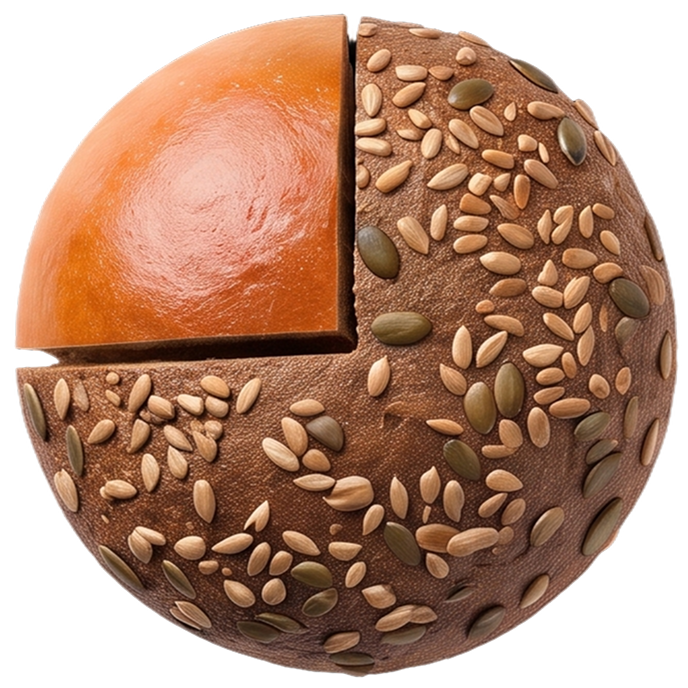
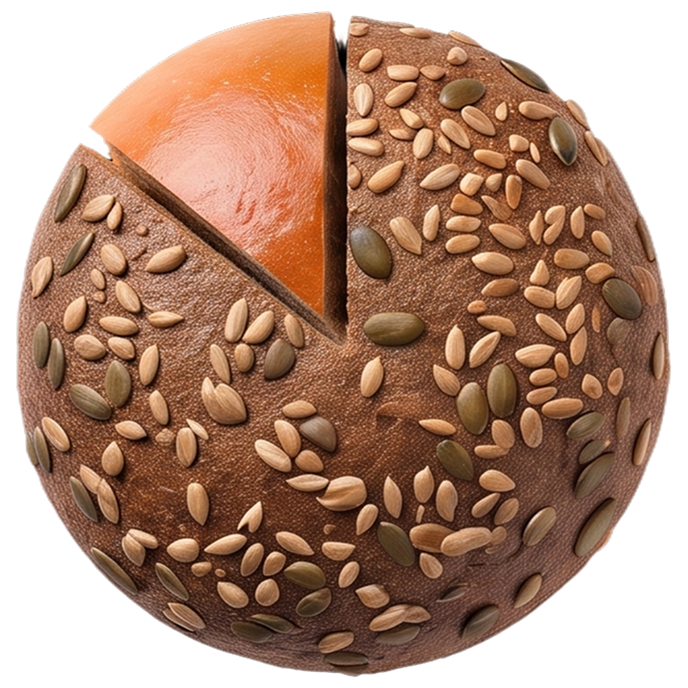
85.5% is expected to get a new purpose.
Of our non-hazardous residual streams, 85.5% is expected to be recycled over 2025, compared with 80.3% a year earlier.
The total volume of residual streams rose from 295.7 to 401.9 tonnes. A higher recycling rate is therefore not the same as fewer residual streams.
Recycled or reusedResidual streamsEach ball is 5 tonnesNon-hazardous residual streams
expected to be recycled
2024: 80.34% · 2025: 85.52%
total volume of residual streams
2024: 295.7 · 2025: 401.88 tonnes
“Finding another purpose is one step. Preventing anything from being left over is the next.”
What still needs to improve
05 · Transport and collaboration
Fresh bread has to be on the shelf on time every day. Some of this we can change ourselves. For the rest, we need suppliers, customers and partners.
Diesel consumption
We are increasingly involving our 34 active suppliers in sustainability agreements.
As of September 2026, 23.5% of our suppliers have signed our Supplier Code. Target for 2026: 90%.
“What can we do better in how we work together?”
Share your ideas
06 · The next improvement
That is why we make our ambitions measurable. For some themes we do not yet have comparable figures over several years. There we show no progress, only what we are working towards. We will report as soon as the data supports it.
CO₂ · scope 1 and 2
Our target: 50% lower scope 1 and 2 emissions by 2031, compared with 2023. Validated by the Science Based Targets initiative.
Each ball is 50 tonnes of CO₂. Move your mouse through them.
Smarter transport starts with conscious choices in the supply chain. With more efficient routes, we drive fewer kilometres for the same delivery.
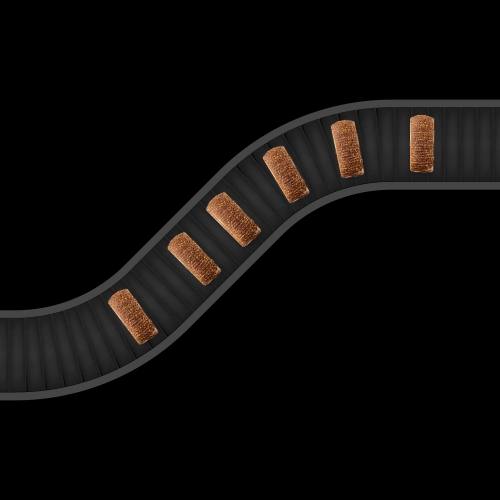
Our impact begins before a raw material even reaches the bakery.
Water is precious. We are actively steering towards using less, compared with 2020.
Thinner films, mono-materials and reusable solutions. In 2025 we used around 45 million packages.
What we bake, we want to use. Whatever is left over gets a new value: bread leftovers become animal feed, for example.
Ovens, refrigeration and production lines run continuously. That is exactly why every improvement counts.
For 2024 we calculated 15,306 tonnes of CO₂e in the supply chain (scope 3). More than three times our own emissions.
Everything side by side
Source: De Paauw sustainability reports (VSME) for 2024 and 2025. Percentages are rounded.